R htmlwidget for datamaps, plot choropleth, overlay arcs and bubbles, customise options, easily interact with Shiny proxies.
Installation
# CRAN release
install.packages("datamaps")

# Development version
devtools::install_github("JohnCoene/datamaps")
Development version includes 2 plugins, add_icons and add_markers.
Info
- See website for demos.
- Includes proxies to update the visualisation without re-drawing entire map.
- See NEWS.md for new features and bug fixes
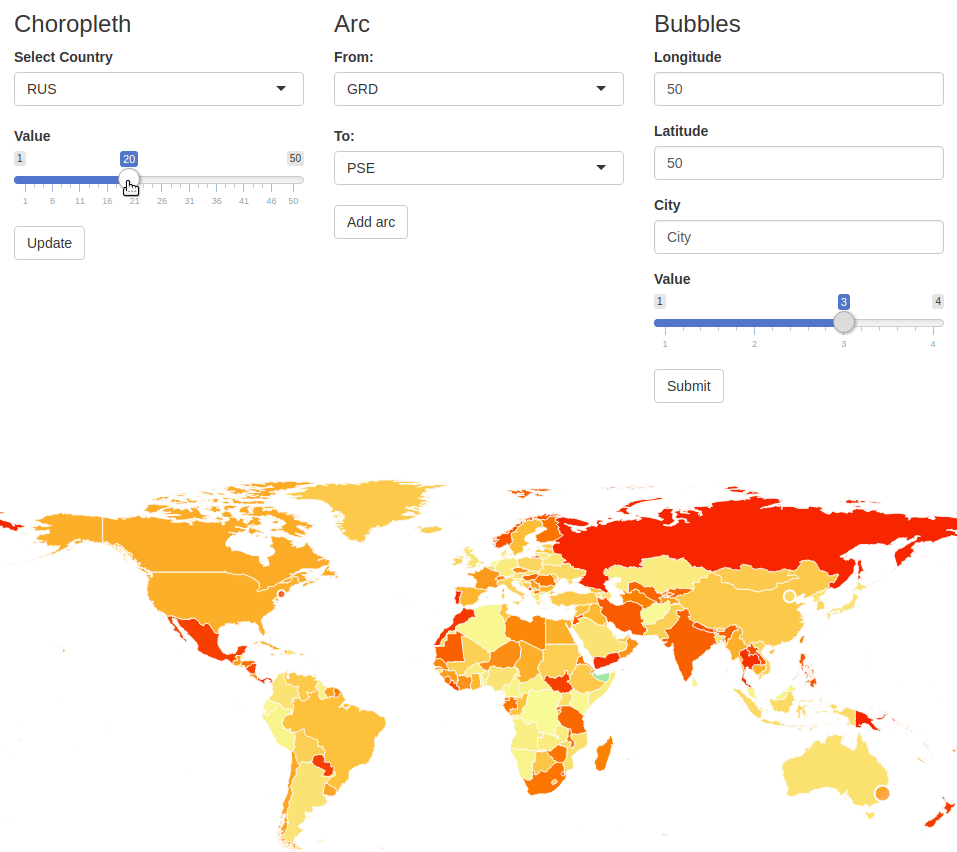
Shiny Proxies
-
update_bubbles- update bubbles. -
update_choropleth- update choropleth values. -
update_labels- update labels. -
update_legend- update the legend. -
update_arcs- update arcs by coordinates. -
update_arcs_name- update arcs by name. -
delete_map- delete the map.
Examples
Example proxy.
demo
library(shiny)

ui <- fluidPage(

  textInput(
    "from",
    "Origin",
    value = "USA"
  ),
  textInput(
    "to",
    "Destination",
    value = "RUS"
  ),
  actionButton(
    "submit",
    "Draw arc"
  ),
  datamapsOutput("map")
)

server <- function(input, output){

  arc <- reactive({
    data.frame(from = input$from, to = input$to)
  })

 output$map <- renderDatamaps({
   datamaps()
 })

 observeEvent(input$submit, {
   datamapsProxy("map") %>%
     add_data(arc()) %>%
     update_arcs_name(from, to)
 })

}

shinyApp(ui, server)
}
